 Qualimetry
Enterprise
Qualimetry
Enterprise
Your whole software estate, in one report
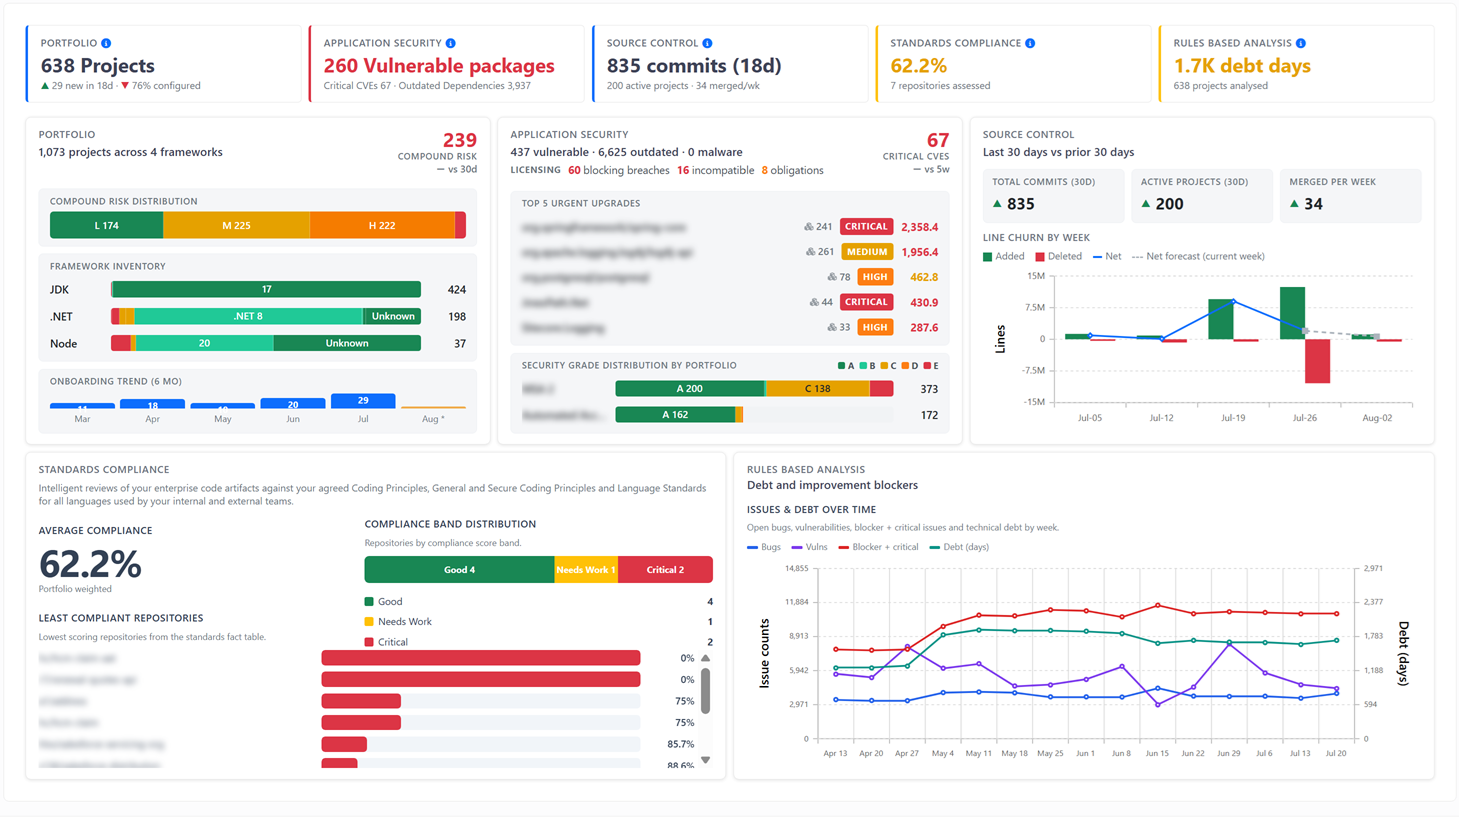
Not a per-repository dashboard you have to visit fifteen times. Enterprise Reporting covers every project you have onboarded, grouped by the structure you actually run the business with, in Qualimetry's own analytics rather than in someone else's tool.
Portfolio, security, source control, compliance and analysis, together
The reporting home is the answer to the question a leadership team actually opens the tool to ask: what is the state of everything we own, right now.
Headline measures, charts, then the detail
Every report follows the same shape, so nobody has to relearn the layout. The headline answers the question, the charts show the shape, and the grid takes you to the specific project.
- Group by portfolio, domain, journey, owning team or whatever taxonomy you use.
- Filter by time window, severity and status without leaving the page.
- Export to Excel, so the report can go into a pack rather than a screenshot.
Everything you can report on
All of them covering the whole estate rather than one repository at a time.
Home
The estate at a glance across portfolio risk, security, source control, standards compliance and analysis.
Operations
Analyses run, minutes consumed and cluster depth, so you can see whether the engine is keeping up.
Delivery Health
Release readiness, lifecycle health, promotion flow, lead time and the quality delta between development and live.
Project Catalog
What is onboarded, whether it is configured correctly, and when it was last analysed successfully.
Technology Stack
The build engines, frameworks, SDK levels and package managers you actually run, extracted from real builds.
End of Life
Products and versions past or nearing end of support, with upgrade targets, readiness and priority.
Application Security
Security ratings and dependency risk per project, the vulnerable components themselves, and licensing.
Repositories
What is in scope, what is active, what has gone stale, and whether branch protection is actually configured.
Code Churn
Where change concentrates, knowledge spread, and single-owner key-person risk read as team health.
PR Workflow
Cycle time, lead time, first review, approvals and post-review commits across the flow.
Standards
Compliance per project with the policy, principle and language-standard pillars scored separately.
Reviews
Review volume, approval and resolution rates, turnaround, and findings by severity and pillar.
Quality Gates & Debt
Gate status, blockers, technical debt and maintainability from rules-based analysis.
Code Health
Complexity, duplication and the projects that would repay refactoring first.
Coverage
Test coverage and pass rate, the coverage gap, and coverage on new code specifically.
Standards and reviews, reported across the estate
These two reports answer the question that actually gets asked in a governance meeting: are we following our own rules, and is anyone checking?
- Compliance and grade per project, with the pillars scored separately.
- Review coverage so you can see where reviews are not running at all.
- Findings by severity and pillar to show what kind of debt you are carrying.
- Approval and resolution rates and how long turnaround actually takes.
See what is active, and what has gone stale
Qualimetry shows which repositories are in scope, which are actively changing, and which branches have gone quiet, so nothing drifts out of view.
- Repositories in scope across the estate, in one place.
- Active versus stale banded by how long they have been quiet.
- Branch protection and approvers so you can see where the controls are missing.
Find where change and knowledge concentrate
Line churn shows where code is being reworked, while a bus-factor view highlights single-owner areas and key-person risk, read as team health rather than a judgement of individuals.
- Line churn and rework that reveal where change concentrates.
- Knowledge spread across the people touching each area.
- Key-person risk where a single owner holds too much.
Understand how pull requests move
Cycle time, lead time, first review and approvals across the flow, with human, agent and bot activity attributed separately rather than lumped together.
- Cycle and lead time from first commit through to merge.
- First review and approvals so you can see where work waits.
- Post-review commits, which is the honest measure of rework after feedback.
- Human, agent and bot activity attributed separately across the flow.
Measure how quickly work reaches production
Release readiness, promotion cadence and the drift between development and live branches, including the quality, coverage and compliance delta between them.
- Lead time by project from development toward production.
- Commits ahead and behind so drift is visible before it becomes a merge problem.
- Quality, coverage and compliance deltas between development and live.
- Promote or hold as an explicit recommendation, with the evidence behind it.
See the technologies you actually run
Not what an architecture diagram claims, but what the build files say. Extracted from real builds, so it is current rather than aspirational.
- Build engines, toolsets and wrappers per project.
- Mobile SDK levels and plugin versions, which is where end-of-life risk hides.
- Package managers and runtime versions across the estate.
- Legacy framework flags, so the modernisation backlog writes itself.
From one team to the whole enterprise
Where this sits in Continuous Analysis
None of this works as a separate product. Each stage exists because of the one before it and is only worth doing because of the one after it.
Enterprise Reporting, answered
Is this per repository or across the estate?
Can we group and filter by our own structure?
Can we get the data out?
Do you integrate with Jira?
See your estate, reported
Book a demo and see these reports populated from your own repositories.